Observability
Syndica provides comprehensive observability tools to monitor your DApp's performance, debug issues, and optimize usage. Gain visibility into every request, track performance metrics, and identify optimization opportunities.
Logs
Real-time request and response logs with extensive filtering capabilities. After adding Syndica's API to your app and configuring your Stacks and API Keys, the logging platform becomes a powerful tool for analyzing application performance.
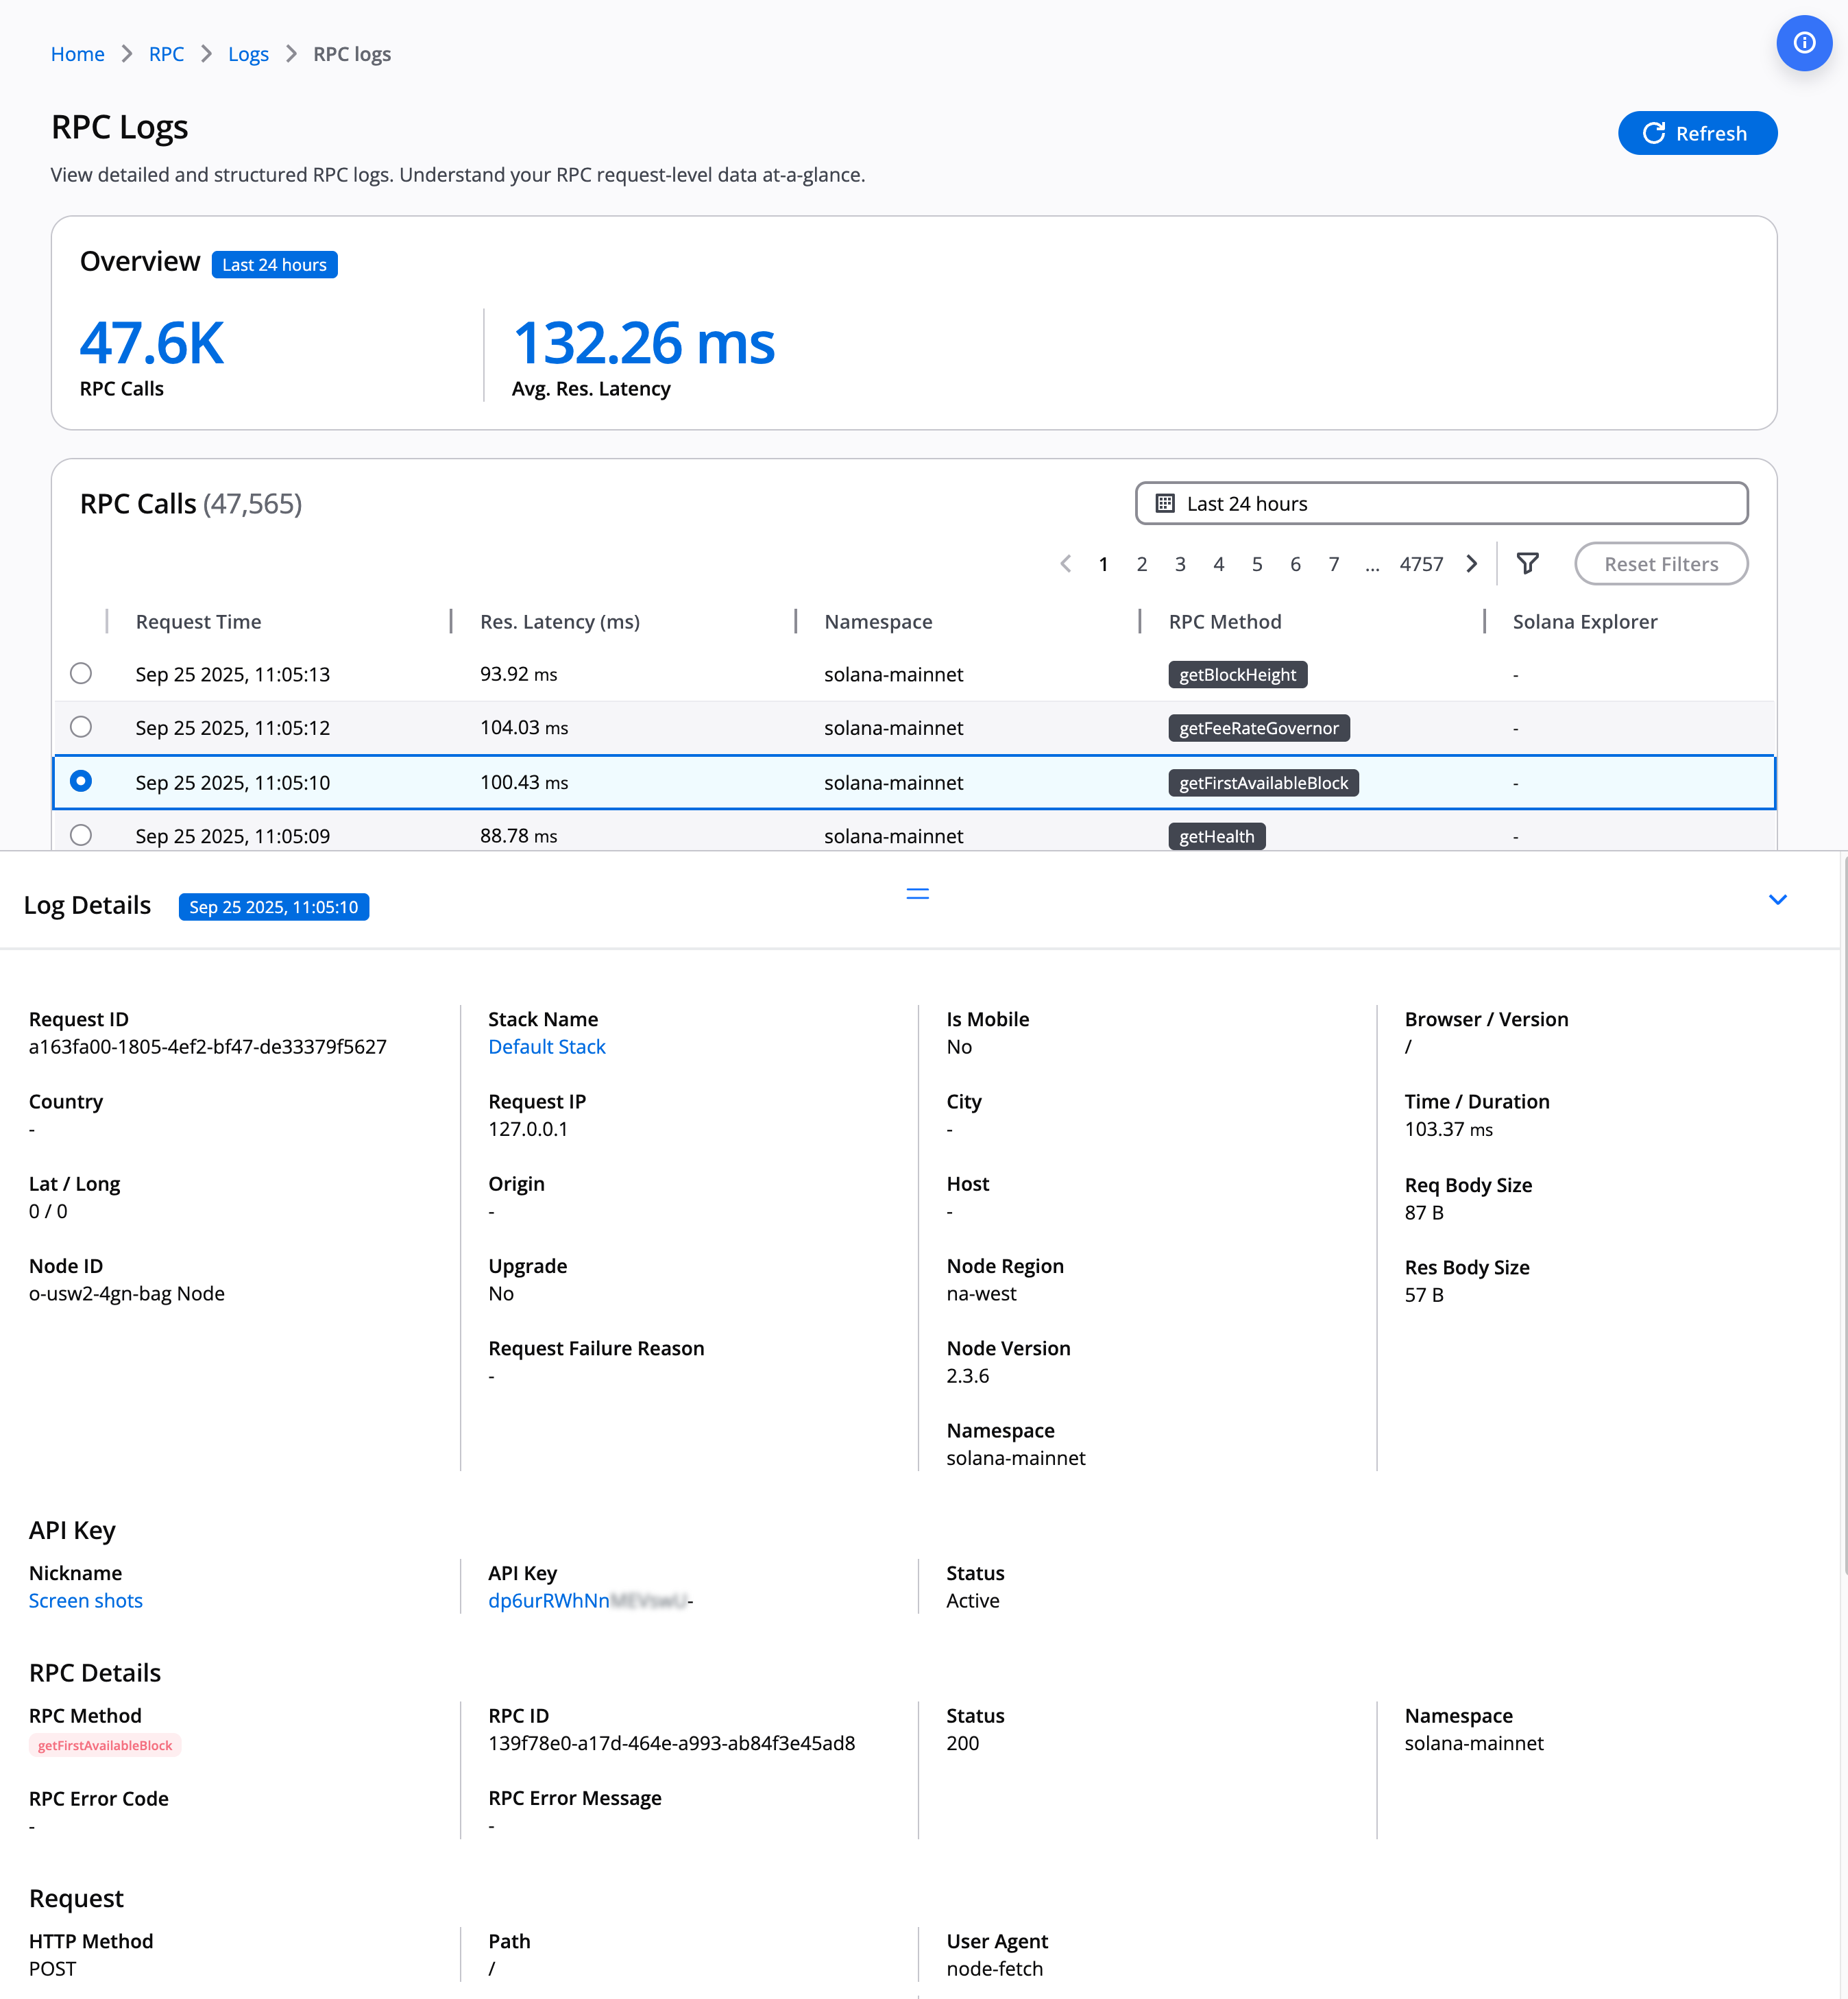
What's in the Logs?
Each log entry captures detailed information about API requests:
- Request method and parameters
- Response status and payload
- Timestamp with millisecond precision
- API key used
- Request origin and IP address
- Geographic location
- Device type (mobile vs desktop)
Filtering and Searching
Filter logs by multiple attributes to quickly find relevant data:
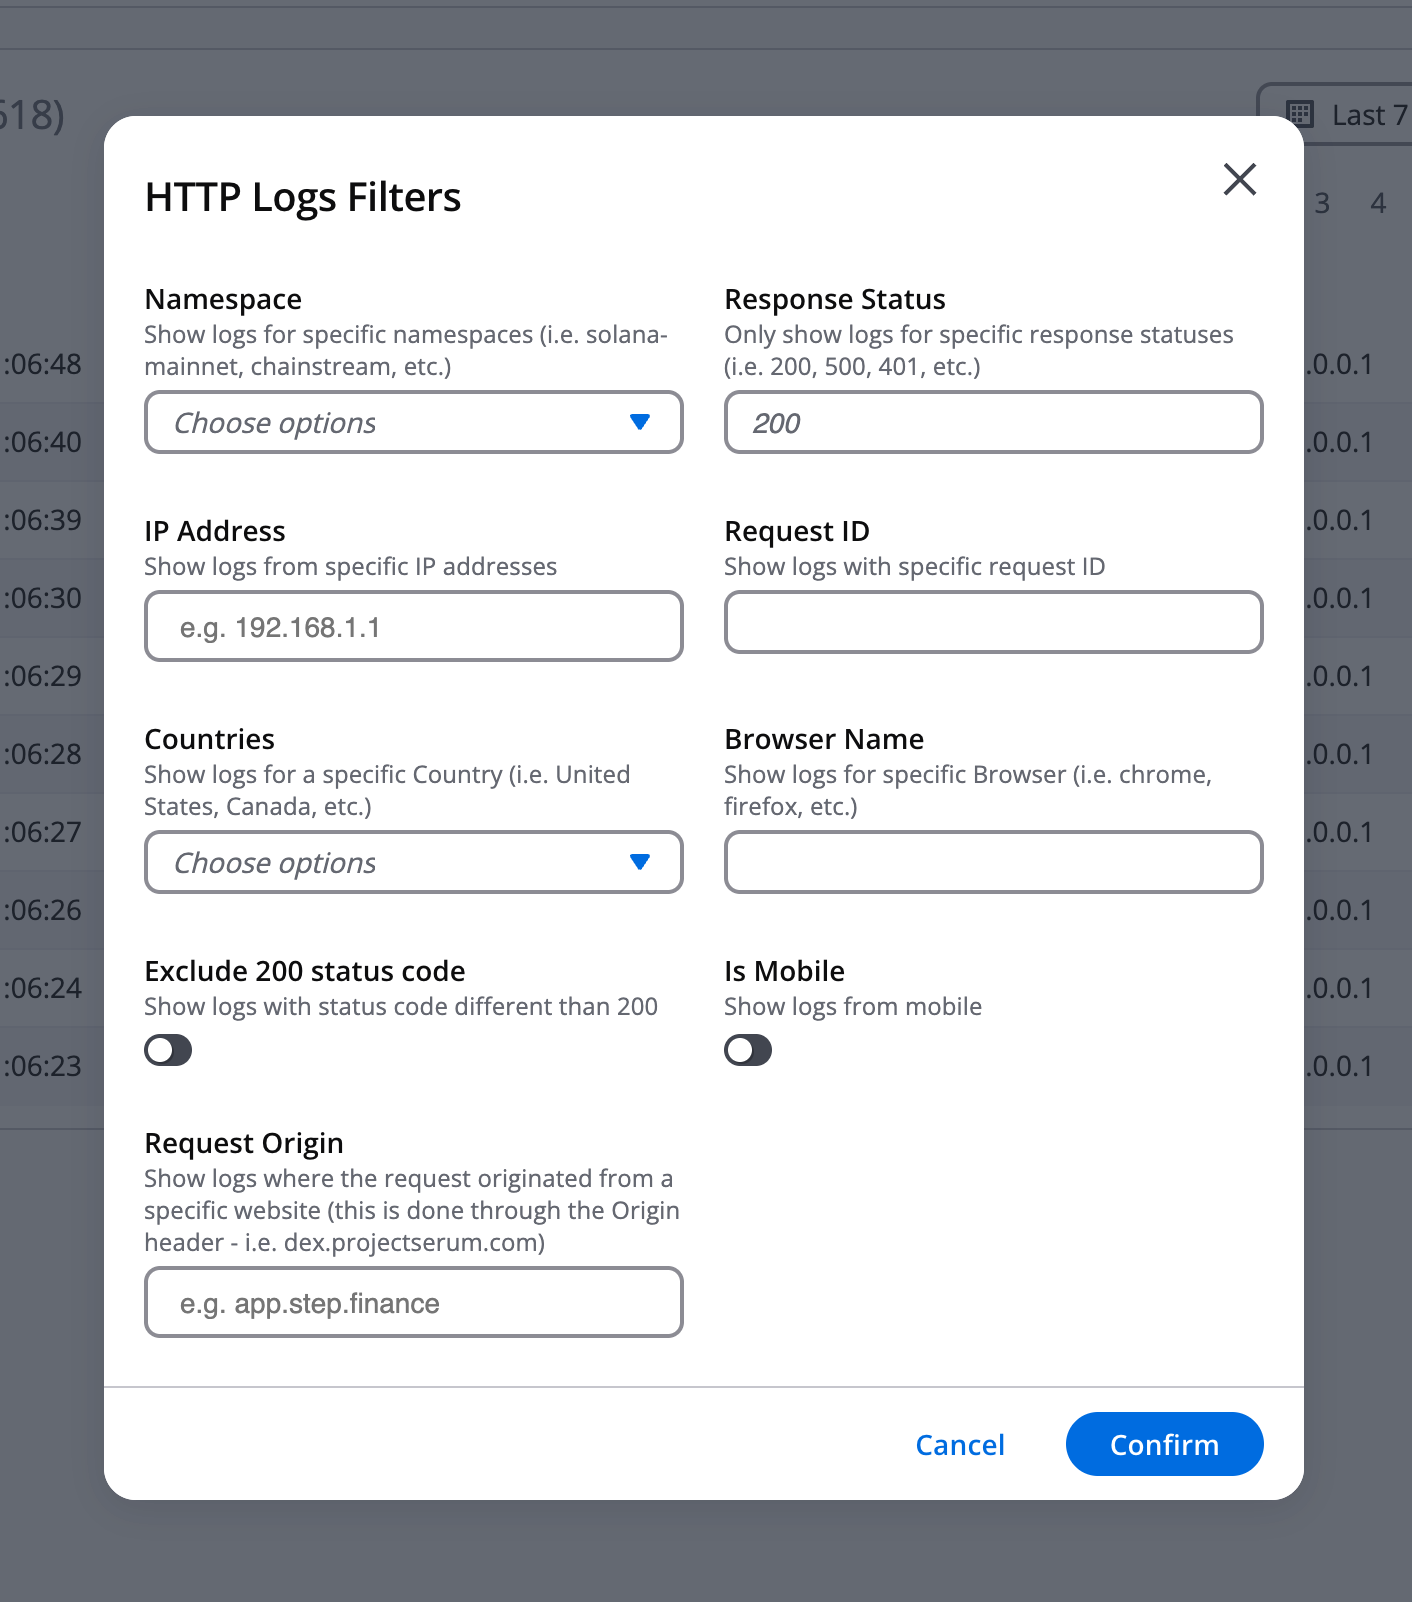
Available filters:
- IP Address (e.g.,
192.168.1.1) - RPC Method (e.g.,
getBalance,getSlot) - Response Status Code (e.g.,
200,401,403) - Request Type (
RPCorWebSocket) - Request Origin (domain or application)
- API Key (filter by specific credential)
- Country (geographic location)
- Device Type (Mobile vs Desktop)
Time Range Selection
Drill down to precise time slices for detailed analysis:

Use the calendar control to select a date range, then specify precise time ranges in the format HH:MM:SS:MS for millisecond-level granularity.
Analytics Dashboard
Visualize key performance metrics including:
- RPS (Requests Per Second): Track request volume over time
- Latency Percentiles: Monitor p50, p95, p99 response times
- Error Rates: Identify and investigate failures
- Usage Patterns: Segment data by Stack, tag, method, or time range
The analytics dashboard helps you understand performance trends and optimize your DApp's resource usage.
Transaction Analytics
Monitor transaction performance from submission to confirmation:
- Slot Latency: Time from transaction submission to slot inclusion
- Landing Rates: Percentage of transactions successfully confirmed
- Transaction Tracking: Follow individual transactions through the confirmation process
- Performance Insights: Identify bottlenecks in transaction processing
WebSocket & Stream Monitoring
Track real-time connection health for WebSocket subscriptions and ChainStream:
- Active Connections: Monitor current WebSocket connections
- Subscription Counts: Track active subscriptions by type
- Stream Health: Identify connection issues or performance degradation
- Usage Metrics: Understand subscription patterns and resource consumption
FAQ and Troubleshooting
How do I know if I'm hitting rate limits?
Rate limit responses return HTTP 429 status codes. You can monitor your usage in the RPC Analytics dashboard. See Observability to learn how to inspect logs and metrics when diagnosing throttling, review Rate Limits and plans/pricing for plan-specific limits, or configure custom rate limits per API key.
Why did my WebSocket connection close?
Connections close automatically when they violate one of our guardrails:
- No active subscriptions: After the handshake we wait ~5 seconds for your client to create a subscription or send a keepalive. If nothing happens, the socket is recycled.
- Inactivity timeout: If we do not observe traffic (notifications, client messages, or ping/pong) for 60 seconds, we close the connection. Send ping frames every 20-30 seconds to keep the session warm.
- Credential or auth errors: Missing or invalid API keys (including revoked credentials) trigger immediate disconnects—check for
401errors during the initial upgrade. - Connection limits exceeded: Standard Mode allows up to 100 concurrent WebSocket connections and 100 total subscriptions; Scale Mode raises those limits to 300 connections and 600 subscriptions. Method-specific caps also apply—see Rate Limits and plans/pricing for the full matrix.
Always implement reconnection logic with exponential backoff, resubscribe on reconnect, and see Error Handling plus Observability for guidance on interpreting disconnects.
What You Can Do Next
- Create API keys - Set up credentials to start generating logs
- Make your first RPC call - Begin using Syndica and see logs in action
- Connect to ChainStream - Monitor streaming data performance
- Rate limits - Understand rate limits and monitor usage